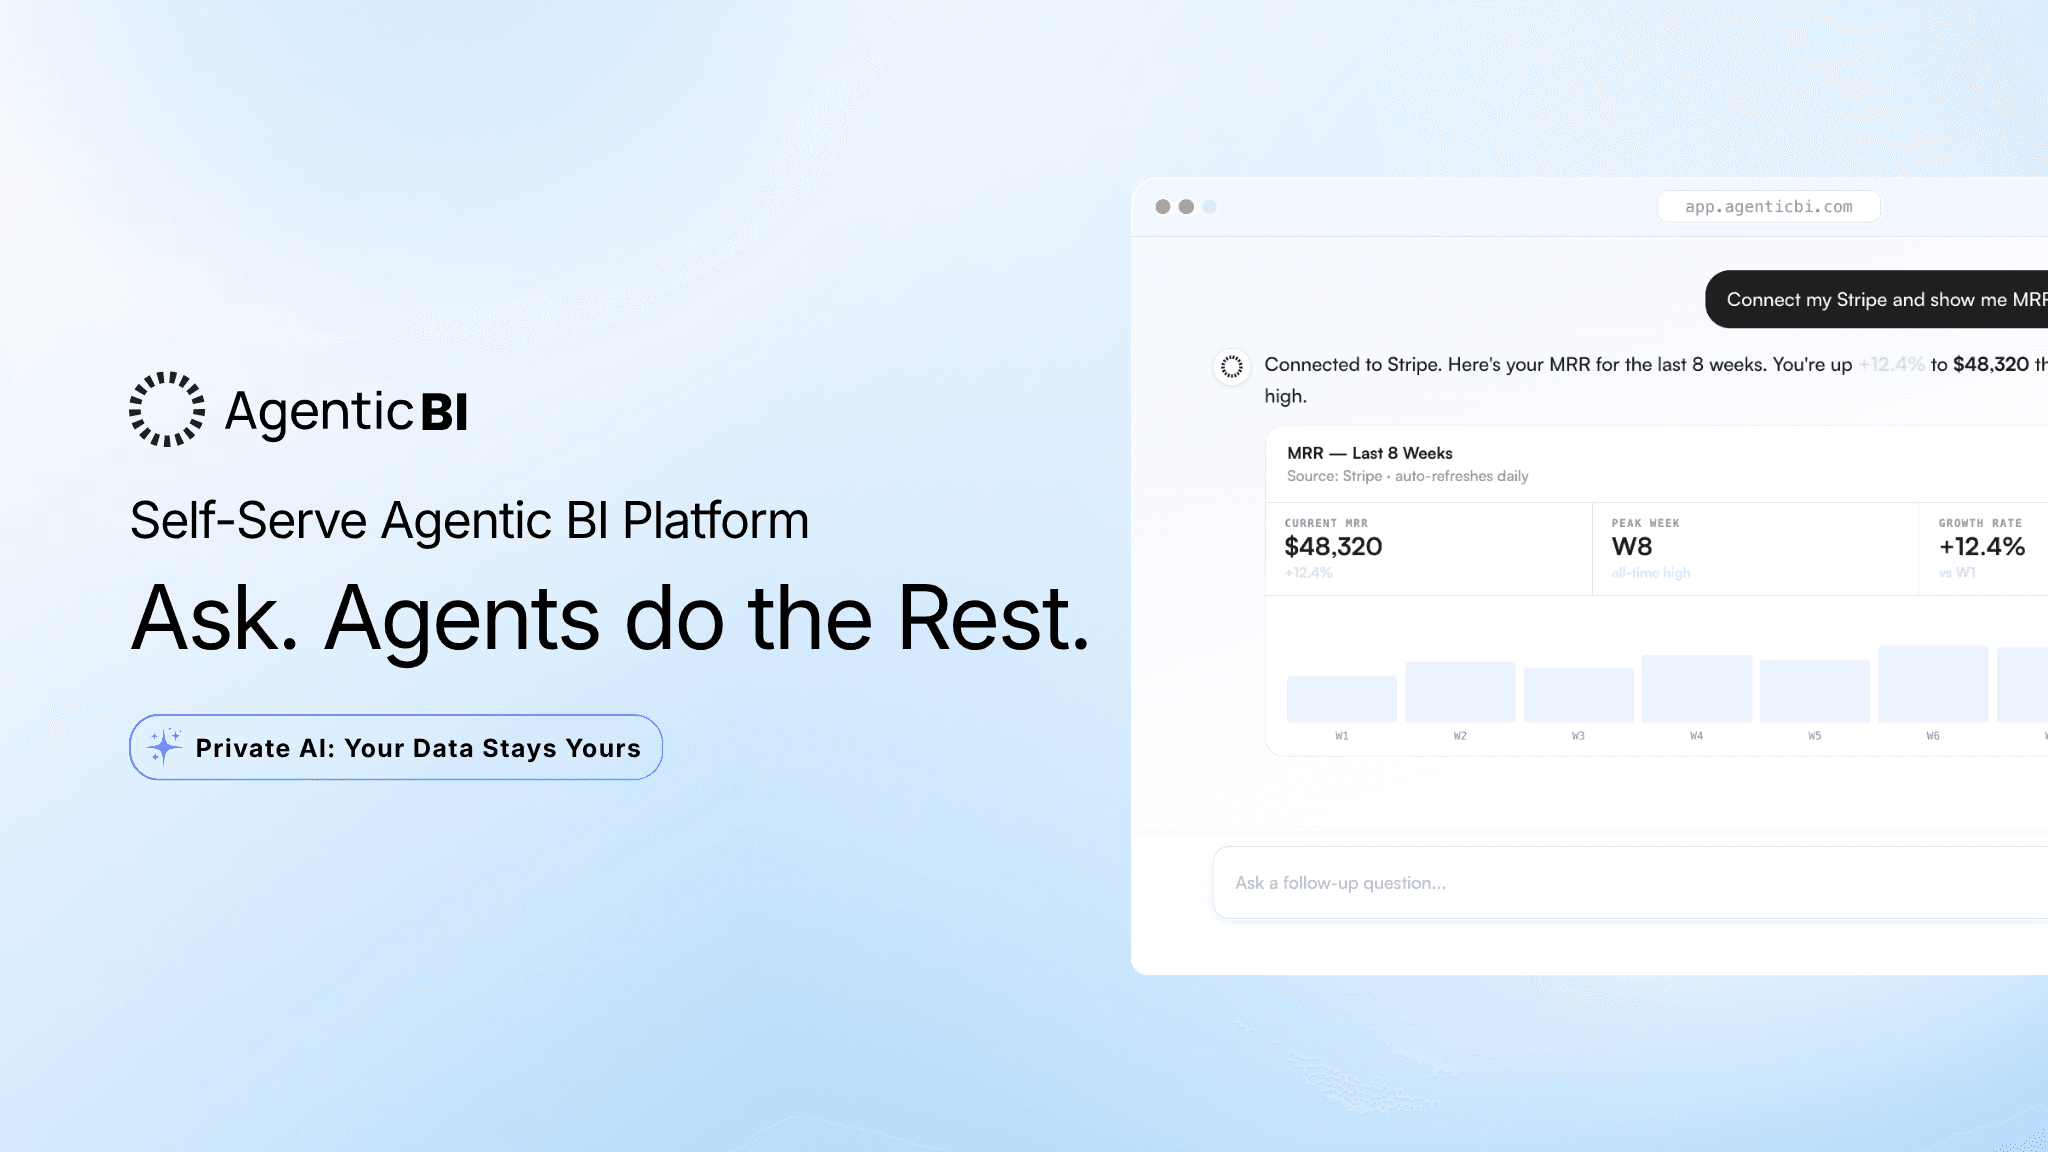
Agentic AI Analytics Platform: From Question to Answer Without the Data Work
Most AI analytics platforms help you do analytics. They give you query builders, dashboard editors, chart configurators, and a drag-and-drop interface. Then you do the work. AgenticBI removes the work. You ask a question. The agents handle everything between the question and the answer. Here is exactly what that looks like, step by step.
Quick Summary (TL;DR)
The typical analytics workflow has 6 steps between your question and your answer. AgenticBI has 2: connect your data, ask your question.
You don't write SQL, build dashboards, configure charts, or figure out schemas. You authenticate a source and start asking.
Agents don't just return a number. They surface the patterns and anomalies in your data that you wouldn't have thought to look for.
Once you've seen the answer, you can ask follow-up questions in plain language and get new charts instantly, without starting over.
Alerts run automatically. When conversions drop below a threshold, you get a Slack message. You didn't have to remember to check.
AgenticBI works with MongoDB, Salesforce, Stripe, SQL databases, and 70+ other sources. No ETL. No warehouse required.
Start with 100 free credits. The first answer from your real data takes about 5 minutes.
The Work You're Used to Doing
Ask a question about your business data today and here's what happens. You open a dashboard tool. You find the right dataset, or you ask someone who knows where it lives. You write a query, or you wait for someone else to write it. You configure the visualization. You run the analysis. You get the answer.
That's the workflow most teams are running in 2026. Six steps. And at least two of those steps require someone who knows SQL or knows your data well enough to find the right table. If you don't have that person, you either wait or you guess.
AgenticBI cuts the workflow to two steps. Connect your data. Ask your question.
Step 1: Connect Your Data Source
The onboarding flow starts with a connection. You pick your source: Salesforce, Stripe, MongoDB, a SQL database, or one of 70+ supported connectors. You authenticate with read-only credentials. That's it.
In the demo walkthrough, the connection was a MongoDB data source. Thirty seconds to authenticate. No configuration. No schema mapping. No pipeline to set up.
Once the connection is live, AgenticBI reads your actual data structure. It knows what's in there. It knows your field names, your data types, your collection structure. You don't have to explain any of it.
Step 2: Tell the Agent What to Analyze
After connecting, you're shown the data available in your database. You pick what you want to analyze. In the demo, that was marketing campaign performance data.
You're not writing a query. You're selecting from what's actually there. The agent takes it from there.
It pulls the data. It previews it. You confirm it looks right. Then you click create.
Step 3: The Agent Builds Your Dashboard
You didn't configure a chart. You didn't drag anything onto a canvas. You didn't pick chart types or set axis labels.
The agent looked at the data, decided what was worth showing, and built the dashboard. In the demo, that meant total conversions as a KPI card, conversions broken down by campaign, and a ranking of top-performing campaigns.
The whole thing took under a minute from the moment the data source was connected.
This is the part that's different from every other tool in this space. The dashboard exists because the agent built it, not because you did. You didn't have to know what to build. You didn't have to know what the data could show. The agent figured that out.
Connect your data. Ask a question. Get the answer. No SQL, no dashboard building, no analyst required. Start with 100 free credits at AgenticBI.com.
Step 4: Read What the Data Is Actually Telling You
Alongside the charts, AgenticBI surfaces AI-powered recommendations based on the data it analyzed. Not generic tips. Specific observations about your actual numbers.
In the demo, the recommendations flagged that certain campaigns resonate with customers better than others, and that seasonality likely plays a factor in conversion performance: peak shopping seasons may be driving some of the variance in results.
These are the patterns that would take a data analyst an hour to surface. A non-technical founder would likely miss them entirely. They came back automatically, on the same screen as the dashboard, without a second request.
This is the job a data analyst does when you hire one. Spot what the data is saying beyond the obvious number. AgenticBI does it without the hire.
Step 5: Ask Follow-Up Questions
The dashboard is a starting point. The real value is what you can ask next.
In the demo, the follow-up question was: "Show total conversions by campaign." A few seconds later, a new chart appeared. Conversions broken down by campaign name, ranked visually. The rewards campaign, more artists, more music, and 30% off limited sale were the highest performers.
You typed a sentence. You got a chart. You didn't rebuild anything. You didn't open a new query editor. You asked, and it answered.
That's the interaction model for the entire product. Every question you have about your data is a sentence away. The agent runs the query. You get the chart. You ask the next question.
You can also save any chart directly to your dashboard. If a particular view becomes something you check regularly, one click adds it to the page.
Step 6: Set Up Alerts So You Don't Have to Check
Here's where the "removes the work" framing becomes most concrete.
You can create an alert for any metric. In the demo example: send a Slack message when conversions drop below a certain value or fall more than a set percentage week over week. You configure it once. After that, you don't have to remember to check.
The alert fires automatically. It lands in your Slack channel or Teams workspace, or it triggers a webhook, before you noticed the problem in a meeting. You didn't have to log in to find out. The number came to you.
This is the version of analytics most teams want and almost never get. Not "here's a dashboard you can check." But: "here's the thing you needed to know, already in your inbox."
For more on the Slack delivery model and how alerts work across your data sources, the analytics for small teams post covers how teams set this up without a dedicated data person.
Step 7: Ask Claude for Deeper Insights
Once you have the dashboard, you can pass it to Claude for a deeper analysis. AgenticBI works as a data broker for MCP-enabled tools: Claude, Gemini, and others can query your data through AgenticBI's agent layer.
This is the right way to think about the Claude integration. Not "Claude analyzes your data." Claude doesn't know your schema or which database to query. AgenticBI handles the data connection and the query. Claude handles the reasoning on top of real numbers.
You get Claude's reasoning applied to accurate data, not to whatever Claude guesses your data looks like. That distinction matters every time you try to make a decision from the answer.
What You End Up With
At the end of the flow from the demo, here's what exists: a live dashboard with your actual data, auto-generated by an agent. A set of AI recommendations about patterns in that data. A follow-up chart from a one-sentence question. And an active alert that will notify your Slack channel the moment a key metric drops.
You did not write SQL. You did not build charts. You did not configure a semantic layer or set up an ETL pipeline. You connected a source, said what you wanted to look at, and asked questions.
That's the entire setup. That's what it looks like when analytics becomes something that happens to you, rather than something you do.
If you're running on MongoDB specifically, the post on getting a dashboard without SQL shows how the connection and query flow works with MongoDB data sources in more detail.
Your data's already in MongoDB, Stripe, or Salesforce. AgenticBI connects to it, builds the dashboard, and delivers the answer. See what 100 free credits gets you at AgenticBI.com.
Frequently Asked Questions
Do I need to write SQL to use AgenticBI?
No. You authenticate your data source and ask questions in natural language. AgenticBI's agents generate and run the queries automatically. The only thing you type is what you want to know.
How long does setup take?
Connecting a data source takes under a minute. Getting your first dashboard from your actual data takes about 5 minutes from account creation. No demo, no onboarding call, no data migration required.
What data sources does AgenticBI connect to?
AgenticBI connects to MongoDB, Salesforce, Stripe, PostgreSQL, MySQL, REST APIs, and 70+ additional sources. You connect with read-only credentials. Your data stays in your environment throughout.
Can I ask follow-up questions after the initial dashboard is built?
Yes. Every question you ask creates a new chart from your real data. You can save any chart to your dashboard. The interaction model is conversational: you ask, the agent answers, you ask again.
How do alerts work?
You set a condition (for example, conversions dropping below a set value week over week) and AgenticBI monitors it automatically. When the condition is met, you get a notification in Slack, Microsoft Teams, or via webhook. You don't have to remember to check.
Is my data sent to OpenAI or another third-party LLM?
No. AgenticBI runs on its own AI engine. Your data is not processed by OpenAI, Google, or any third-party LLM. The AI layer operates privately, which matters for teams with HIPAA requirements, GDPR obligations, or general data security requirements.
What is the difference between AgenticBI and asking Claude to analyze my data?
Claude doesn't have access to your database. It generates answers based on its training data and any context you manually provide. AgenticBI agents are built into your data layer: they know your schema, connect to the right source, run a real query, and return an accurate answer. You get Claude's reasoning applied to numbers that are actually correct.
Try AgenticBI
The AI data analyst for teams without a data team
Your numbers live in your database, your tools, and a dozen spreadsheet tabs, each telling a slightly different story. AgenticBI connects to all of them, runs the query, and hands back one answer. You ask in your own words. Agents do the analysis. And it can run on its own AI, so your data never leaves for a third party.
What you can do with AgenticBI:
Free to start. Your data can stay yours, nothing goes to OpenAI or any outside model.
Learn more
Discover more from the latest posts.


